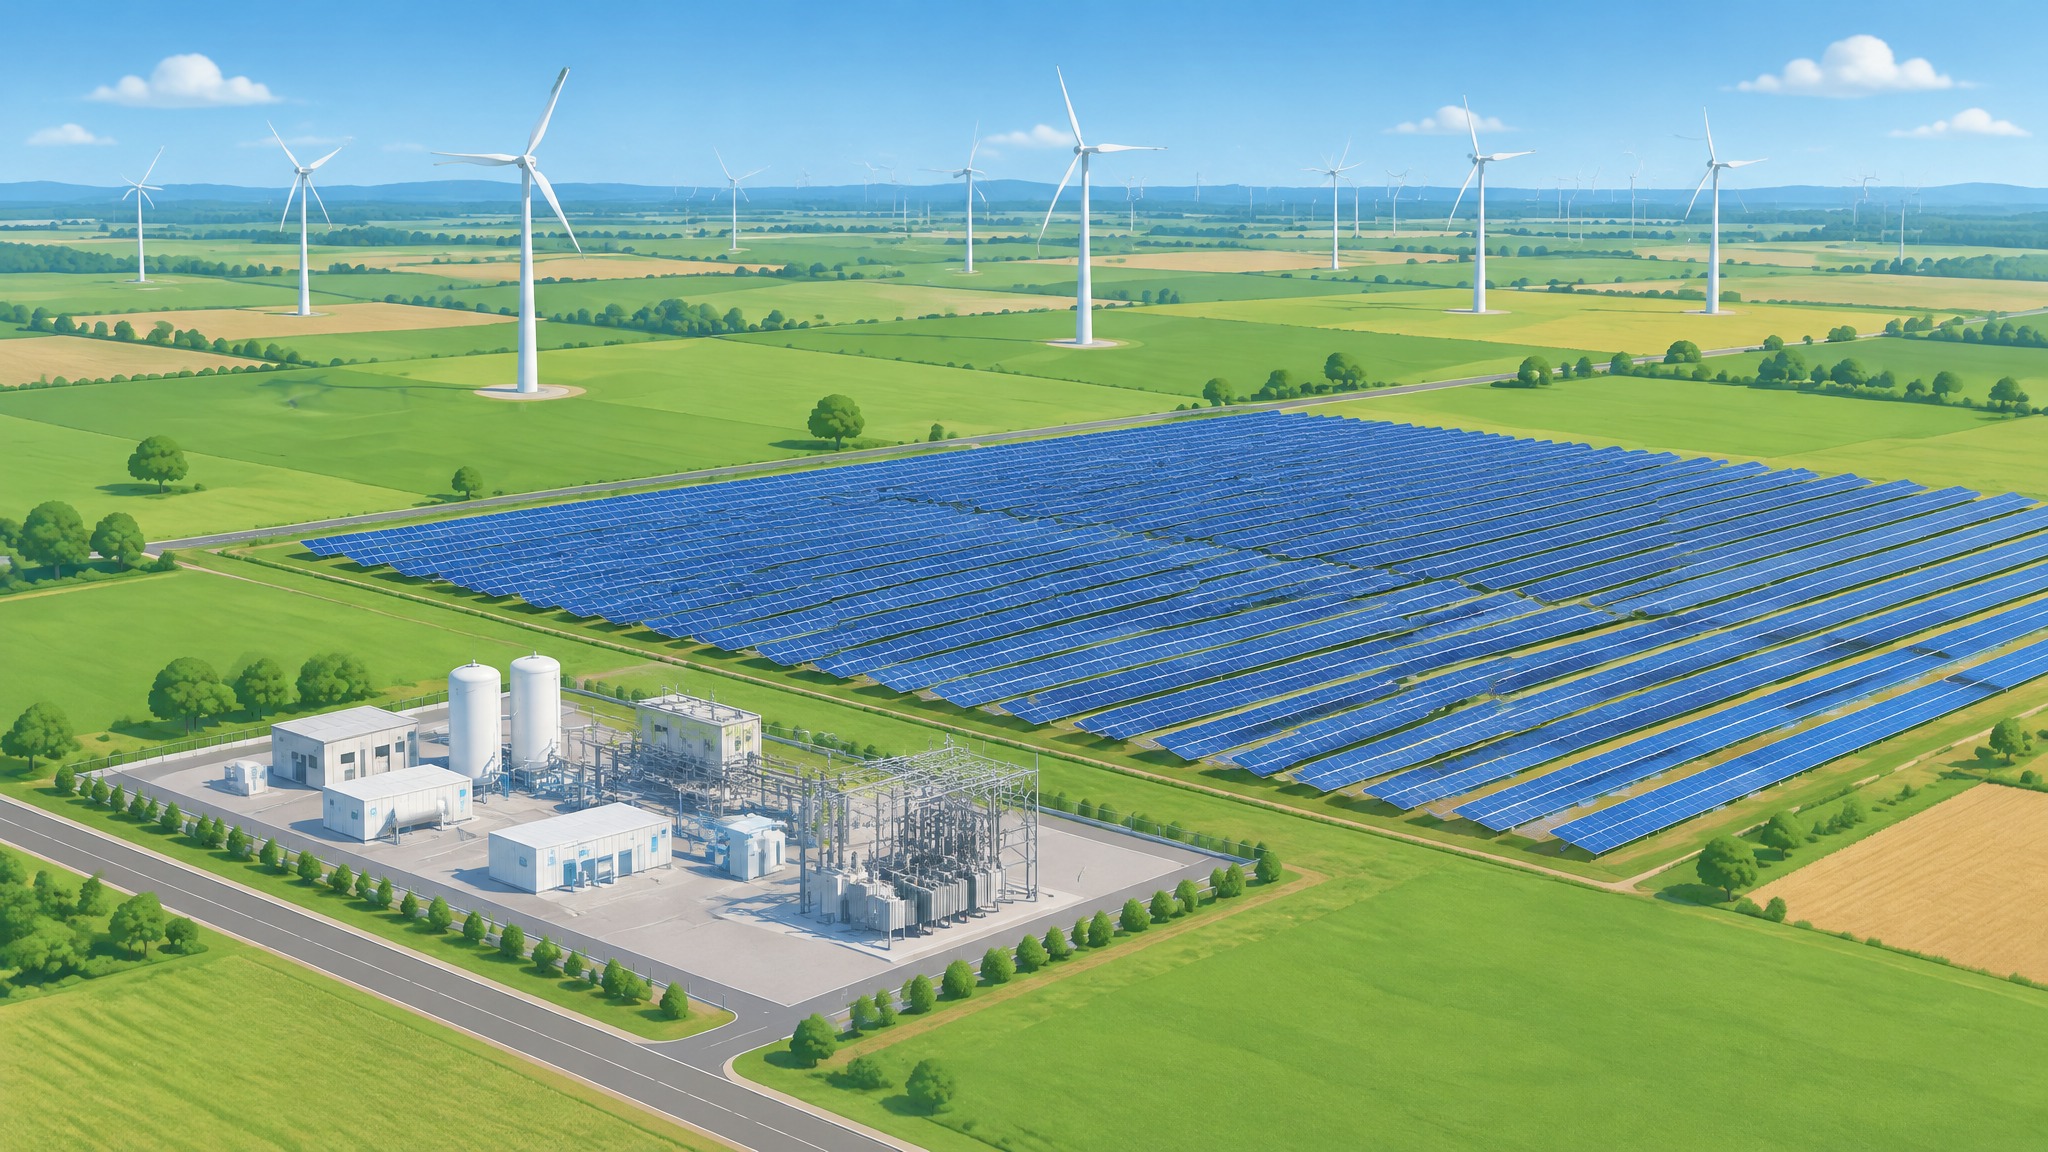
Green hydrogen land requirements depend almost entirely on the power supply, not the electrolyzer: a 100 MW electrolysis plant itself fits on roughly 1 hectare of process area, while the dedicated solar or wind that feeds it can need hundreds to thousands of hectares. In the worked example below, the same 100 MW plant needs about 4 ha on a grid connection, about 352 ha with solar only, and about 4,300 ha of total project area with a wind-solar hybrid.
Short answer: budget the electrolyzer island in single-digit hectares, then size the land from the renewable plant. For solar, published US benchmarks imply about 2.2 ha per MWac for tracking arrays. For wind, the total project area is far larger than the land actually occupied, so the number you quote depends on which of the two you mean.
This is general pre-feasibility guidance, not engineering, legal or investment advice. Confirm all figures with site layouts, local planning rules and qualified engineers.
The real project question
A developer screening sites needs to know early whether a parcel is big enough, how many landowners must be signed, and whether the land cost changes the economics. The mistake is to size land from the electrolyzer nameplate alone. The process plant is compact; the generation that powers an off-grid plant is not.
Land is one of the seven screens in our green hydrogen site selection checklist. This article puts numbers on it, using the same 100 MW supply designs as our solar vs wind for green hydrogen comparison.
Green hydrogen land requirements: the documented inputs
The electrolysis plant
Two published references put the electrolysis island at well under 100 m² per MW:
- The International PtX Hub's land-use briefing (GIZ, February 2024) cites 0.048–0.095 m² per kW for an electrolysis plant, which is 48–95 m² per MW, or about 0.5–1 ha for 100 MW. It is a secondary briefing summarising an earlier study, and it notes that land figures depend heavily on location.
- The Port of Rotterdam's conversion park plans four hydrogen plants on 24 hectares, with 2.5 GW of hydrogen plants by 2030. That planning density works out to about 96 m² per MW. Shell's 200 MW Holland Hydrogen 1 is being built on the same Tweede Maasvlakte area, according to the port's 2022 announcement.
Rotterdam is a dense, serviced port site with shared infrastructure. A standalone greenfield plant usually needs extra room for water treatment, compression, hydrogen storage, a substation, roads, safety distances and a construction laydown area, so the 1 ha figure is a floor, not a design value.
Solar PV
Lawrence Berkeley National Laboratory's empirical study of US utility-scale PV (Bolinger and Bolinger, 2022) measured plants built through 2019 from satellite imagery. Its 2019 median benchmarks are 0.28 MWac per acre for fixed-tilt and 0.18 MWac per acre for single-axis tracking plants. That is about 3.6 acres (1.4 ha) per MWac fixed-tilt and 5.6 acres (2.2 ha) per MWac tracking.
One caveat matters for land acquisition. The authors limited the measured area to the land directly occupied by the arrays and related electrical equipment, and did not include the whole leased or owned parcel (LBNL paper). Setbacks, access roads and unusable corners add to the parcel you actually need.
Onshore wind
NREL's land-use study of US wind plants (Denholm et al., 2009, 172 projects) gives two very different numbers:
| Measure | NREL average |
|---|---|
| Total project area | 34.5 ± 22.4 ha/MW |
| Permanent direct impact (pads, roads, substations) | 0.3 ± 0.3 ha/MW |
| Temporary direct impact (construction) | 0.7 ± 0.6 ha/MW |
The total area is the land inside the project boundary, most of which stays in farming or grazing. The direct impact is the land actually taken out of use, about 1 ha/MW including temporary disturbance. The PtX Hub briefing uses 48 m² per kW (4.8 ha/MW) for wind, which shows how much the figure depends on what is being counted. Always say which one you mean.
Worked example: land for a 100 MW green hydrogen plant
Everything below uses illustrative assumptions, not quotes, project data or H2Hub outputs.
Stated assumptions:
- Electrolyzer: 100 MW. Process plot of 4 ha, an illustrative allowance about four times the roughly 1 ha density above, to cover water treatment, compression, storage, substation, roads and laydown.
- Supply designs and hydrogen output are taken from the cheapest designs in our solar vs wind for green hydrogen example: solar only at 1.55 MW per MW of electrolyzer (5,542 t/yr), wind only at 1.70 (8,699 t/yr), and a hybrid at 2.15 with 45% solar capacity (10,180 t/yr).
- Solar capacity is treated as MWac on single-axis trackers at LBNL's 0.18 MWac per acre (about 2.25 ha/MWac).
- Wind uses NREL's 34.5 ha/MW total area and 1.0 ha/MW direct impact.
- Solar and wind are on separate land; no co-location.
- Transmission lines, water pipelines and buffer zones beyond the plot are excluded.
Results
| Design | Solar | Wind | Solar land | Wind total area | Wind direct | Land occupied | Total project area | Total per 1,000 t/yr |
|---|---|---|---|---|---|---|---|---|
| Grid-connected | 0 MW | 0 MW | 0 ha | 0 ha | 0 ha | 4 ha | 4 ha | n/a |
| Solar only, 1.55:1 | 155 MW | 0 MW | 348 ha | 0 ha | 0 ha | 352 ha | 352 ha | 63.6 ha |
| Wind only, 1.70:1 | 0 MW | 170 MW | 0 ha | 5,865 ha | 170 ha | 174 ha | 5,869 ha | 674.7 ha |
| Hybrid, 2.15:1 | 96.75 MW | 118.25 MW | 218 ha | 4,080 ha | 118 ha | 340 ha | 4,301 ha | 422.5 ha |
"Land occupied" is the process plot plus solar arrays plus wind direct impact. "Total project area" uses the wind project boundary instead of the direct impact.
Three things stand out.
The electrolyzer is a rounding error. Even with a generous 4 ha plot, it is about 1% of the solar-only land and 0.1% of the hybrid's total area. A grid-connected plant can fit on an ordinary industrial parcel.
Solar uses the least total area, wind the least occupied land. The solar-only design needs about 352 ha, roughly 3.5 km², all of it fenced and occupied. The wind-only design spreads across about 5,869 ha, or about 59 km², but only about 174 ha of that is taken out of other use.
Per tonne of hydrogen, wind's advantage on occupied land grows. Wind-only occupies about 20 ha per 1,000 t/yr of hydrogen against about 64 ha for solar-only, because wind runs more hours on less occupied land. The hybrid, the cheapest design in the cost comparison, sits in between on both measures: about 33 ha occupied per 1,000 t/yr, and about 423 ha of total project area.
What moves the answer
- Fixed-tilt solar at LBNL's 0.28 MWac per acre cuts the solar-only land from 348 ha to about 224 ha, at some cost in energy yield.
- Oversizing. Land scales with renewable capacity, so the renewables-to-electrolyzer ratio you choose is also a land decision. Going from 1:1 to the cheapest ratio adds land roughly in proportion.
- Co-location. Solar built inside a wind project's boundary shares land. If the hybrid's solar sits within the wind area, its total project area falls to about 4,084 ha.
- Wind spacing. NREL's ±22 ha/MW spread is large: turbine size, terrain and wind direction change spacing a lot, so treat the wind figures as a range.
What the example leaves out
- Parcel shape and setbacks. Real parcels have boundaries, easements, wetlands and slopes that leave some land unusable.
- Water, pipeline and power corridors. A remote site may need long rights-of-way for water supply, hydrogen or ammonia export and grid backup.
- Safety distances. Hydrogen storage and process areas may need separation distances set by local codes; check them with the permitting authority.
- Product conversion. Ammonia synthesis, liquefaction or large storage adds plot area that this example does not include.
- Land cost. The example sizes land; it does not price leases or purchase.
Try it in H2Hub
You can start a project in H2Hub for free, without an account or a card, for the site you are screening. Use the same baseline as this example, a 100 MW electrolyzer with a hybrid or solar-only supply, and see what your site's resource does to production and cost, then multiply the generation capacity you need by the land densities above to check that it fits your parcel.
Your first full project and its PDF report are free; downloading the PDF needs a free sign-in. Re-running with new inputs or starting a second project requires a subscription, so screen your strongest site first. The Site Selection Lab is a subscriber tool; signed-out visitors see an introduction.
A note on pre-feasibility
The figures above are calculations from stated assumptions and published averages. They are not site layouts, forecasts or H2Hub-generated results, and they do not replace a land survey, a layout study, planning advice or a resource assessment.
Frequently asked questions
How much land does a 100 MW electrolyzer need?
The electrolysis plant itself needs roughly 0.5–1 ha at published densities of about 48–96 m² per MW. A standalone site with water treatment, storage, compression and laydown needs more; our example allows 4 ha.
How much land does a solar-powered hydrogen plant need?
Mostly what the solar plant needs. At LBNL's benchmark for tracking PV, about 2.2 ha per MWac, a 100 MW electrolyzer fed by 155 MW of solar needs about 352 ha including a 4 ha process plot.
Why are wind land figures so large?
Turbines must be spaced apart, so the project boundary covers a large area. NREL found an average of 34.5 ha/MW of total area, but only about 1 ha/MW is directly disturbed; the rest can stay in farming or grazing.
Can solar and wind share the same land for hydrogen?
Yes. Placing solar between turbines lets a hybrid project use one boundary. In our example that cuts the hybrid's total project area from about 4,301 ha to about 4,084 ha.
Primary sources and further reading
- Bolinger, M. and Bolinger, G. — Land Requirements for Utility-Scale PV: An Empirical Update on Power and Energy Density, Lawrence Berkeley National Laboratory, IEEE Journal of Photovoltaics, 2022. Full paper (PDF).
- Denholm, P., Hand, M., Jackson, M. and Ong, S. — Land-Use Requirements of Modern Wind Power Plants in the United States, NREL/TP-6A2-45834, August 2009.
- International PtX Hub (GIZ) — Sustainability Briefing #3: Land use, February 2024. Secondary briefing; land per kW for electrolysis, wind and PV.
- Port of Rotterdam — Realisation of green energy generation park (hydrogen conversion park). Park area and planned capacity, checked 18 November 2026.
- Port of Rotterdam — Shell to start building Europe's biggest green hydrogen plant, 6 July 2022.
Editorial verification: 18 November 2026. Worked examples are calculations from stated assumptions, not forecasts, market prices or H2Hub-generated results.