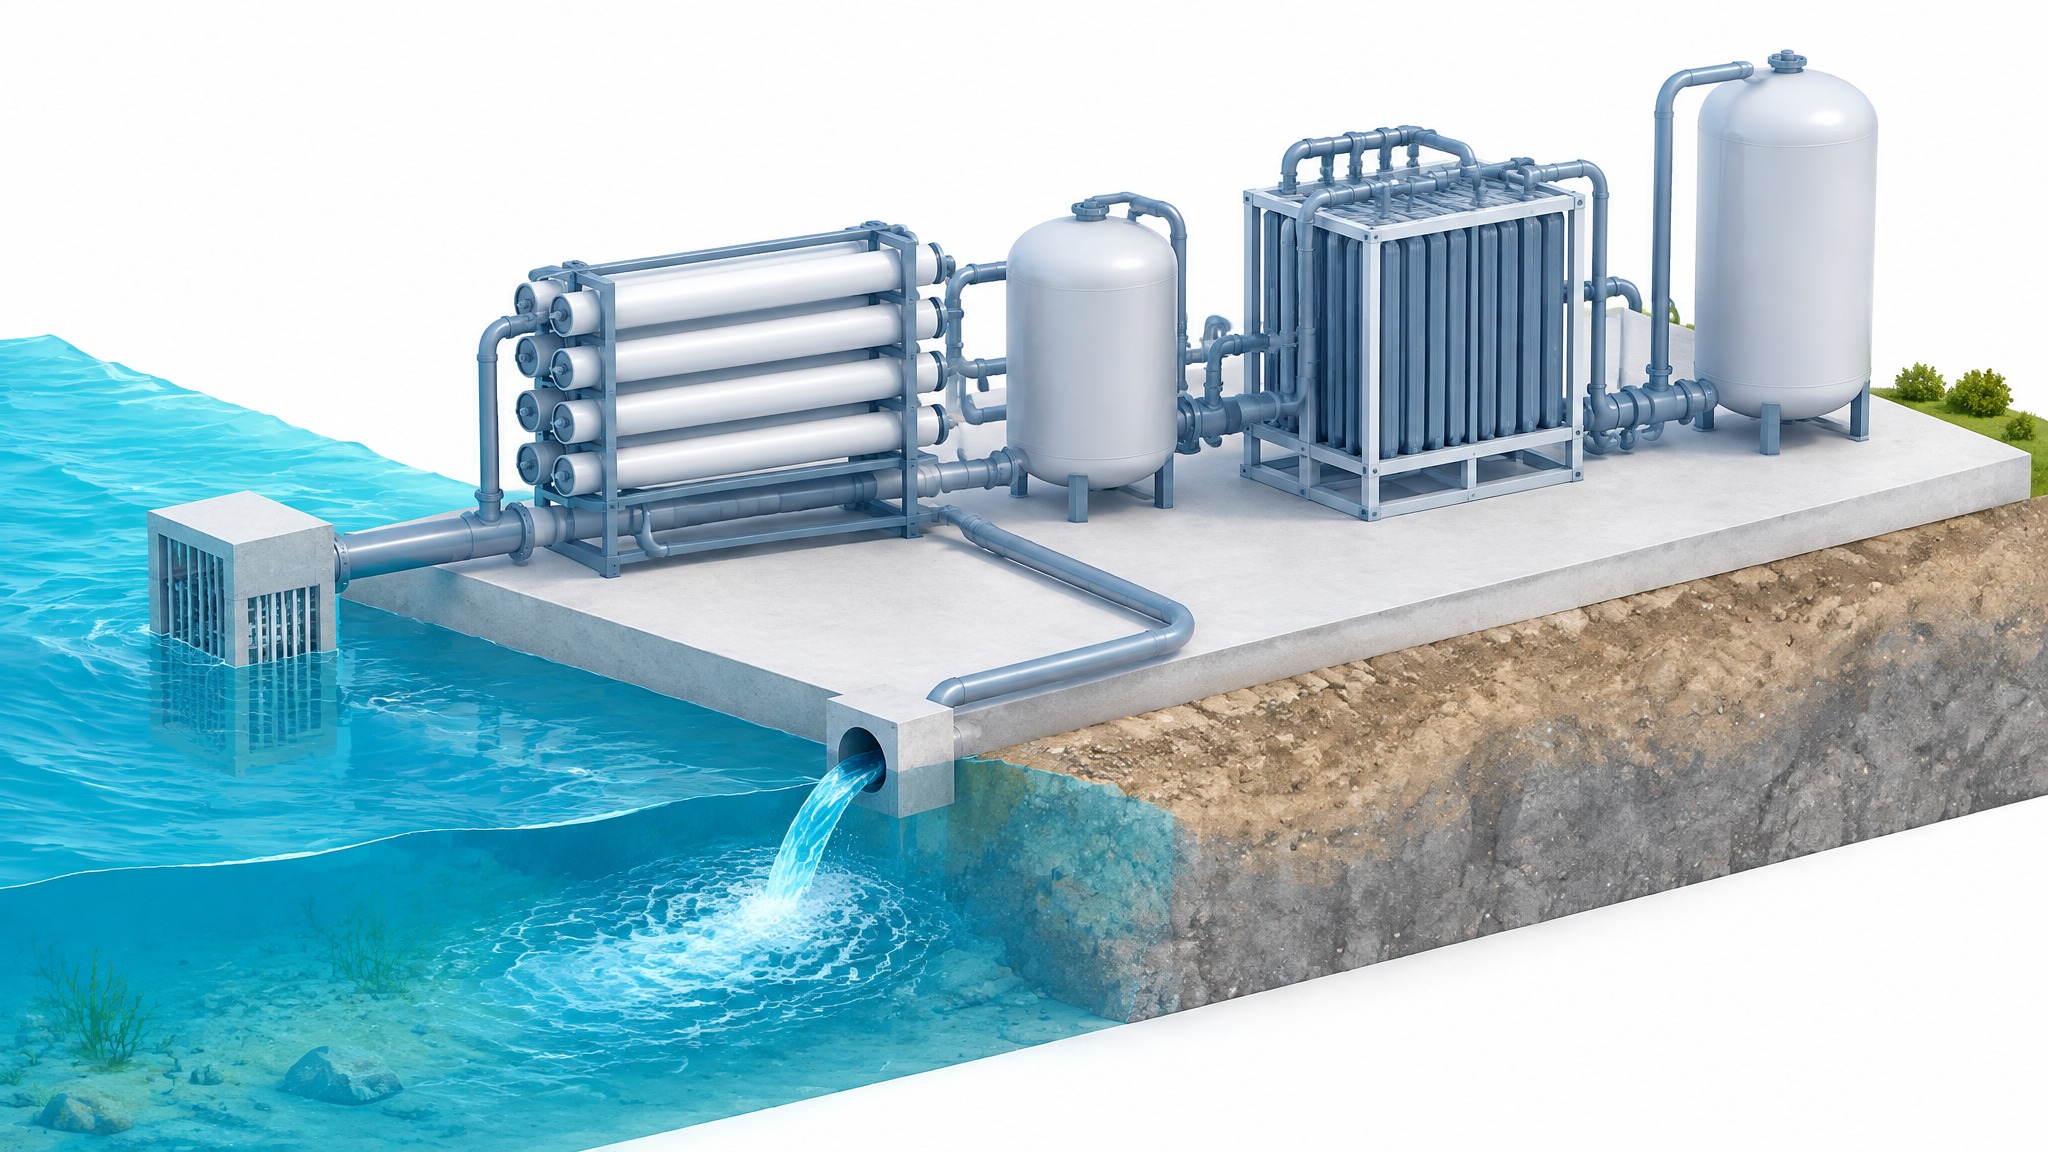
Hydrogen from seawater cost is driven by electricity, not by the water: desalinating seawater for an electrolyzer typically adds only a few cents per kilogram of hydrogen. The U.S. Department of Energy puts the added cost of desalination at approximately $0.01 to $0.04 per kg, and our worked 100 MW example below lands between $0.005 and $0.09/kg.
In short: for a coastal project, a $5/MWh change in power price moves cost per kilogram several times more than the worst desalination case in our example. The questions that can stop a seawater-fed project are not the water price but the intake, the brine outfall, the permits and how the water plant follows a variable electrolyzer.
This is general pre-feasibility guidance, not engineering, permitting or investment advice. Confirm all figures with water-treatment vendors and qualified engineers.
The project question: does a coastal site pay a water penalty?
An engineer screening a coastal site with strong wind or sun usually meets the same objection: "there's no fresh water, so you'll have to desalinate, and that will be expensive." The honest answer has two parts. In cost per kilogram, desalination is small. In project risk, the marine works and discharge approvals can be large, and they belong on the screening checklist from day one.
This article covers seawater desalinated by reverse osmosis (RO) and then polished to electrolyzer feedwater quality. It does not cover direct seawater electrolysis.
Hydrogen from seawater cost: what the documented numbers say
| Input | Documented value | Source |
|---|---|---|
| Reaction water | Minimum 9 kg of pure water per kg of hydrogen | UK Environment Agency guidance, updated 29 Sep 2026 |
| Fresh water used in practice | 9 to 30 litres per kg of hydrogen | International PtX Hub briefing (GIZ), Feb 2024 |
| Seawater RO energy use | About 2.5–6 kWh per m³, including auxiliaries | IEA commentary on desalination |
| Seawater desalination recovery | Around 50% of intake becomes fresh water | PtX Hub briefing |
| Desalinated water cost | Global life-cycle cost below about $0.60 per m³ | EU Blue Economy Observatory, updated 21 May 2026 |
| Upper screening cost | RO and thermal plants produce water below $3 per m³ | IRENA, Global Hydrogen Trade Part III, 2022 |
| Cost impact on hydrogen | About $0.01–0.04 per kg | U.S. DOE water and electrolysis FAQ |
Three points help when reading the table.
Reaction water is a floor. The UK guidance states the 9 kg minimum and says gross intake depends on the electrolysis method, feedwater quality, water recovery and reuse, effluent and the cooling technique. Treatment rejects and cooling can push the figure well above 9 litres, which is why the PtX Hub range runs to 30. Our green hydrogen water requirements guide works through that balance for a 100 MW plant.
Treat the low figure as a floor, not a quote. The EU Observatory's figure of under $0.60/m³ is a global life-cycle cost, and it notes that energy is 40–60% of desalinated water cost. A dedicated plant serving one electrolyzer is likely to be smaller than the plants behind that average, so this example also tests $1.50 and $3.00 per m³.
IRENA left desalination out of its cost maps for a reason. It treated desalination as viable within 50 km of the coast but did not compute the extra cost, because water's share of levelized cost is marginal. In its own example, desalinated water at $3/m³ raised the levelized cost of hydrogen by 3.8%.
Worked example: a 100 MW coastal electrolyzer
All values below are illustrative assumptions, not quotes, project data or H2Hub outputs. The arithmetic was run in Python and only computed results are shown.
Stated assumptions
- Electrolyzer: 100 MW at 55 kWh/kg system electricity use, the 2022 status value in DOE's alkaline electrolysis targets
- Operation: 4,500 full-load hours a year
- Electricity: $45/MWh
- Desalinated feedwater: 9, 15 or 30 litres per kg of hydrogen
- Seawater RO recovery: 50%, so intake is twice the fresh water produced and brine equals the fresh water produced
- RO energy: 3.5 kWh/m³ (base) and 6 kWh/m³ (high)
- Desalinated water cost: $0.60, $1.50 or $3.00 per m³, all-in
Output: 100 MW × 4,500 h ÷ 55 kWh/kg gives about 8,182 tonnes of hydrogen a year, or about 1,818 kg per hour at full load. Electricity alone costs $2.48/kg.
Result: water volumes
| Feedwater use | Fresh water per year | Seawater intake per year | Brine per year | Peak fresh water at full load |
|---|---|---|---|---|
| 9 L/kg | 73,636 m³ | 147,273 m³ | 73,636 m³ | 16.4 m³/h |
| 15 L/kg | 122,727 m³ | 245,455 m³ | 122,727 m³ | 27.3 m³/h |
| 30 L/kg | 245,455 m³ | 490,909 m³ | 245,455 m³ | 54.5 m³/h |
Result: cost per kilogram of hydrogen
| Feedwater use | At $0.60/m³ | At $1.50/m³ | At $3.00/m³ |
|---|---|---|---|
| 9 L/kg | $0.005 | $0.014 | $0.027 |
| 15 L/kg | $0.009 | $0.023 | $0.045 |
| 30 L/kg | $0.018 | $0.045 | $0.090 |
The base case, 15 L/kg at $1.50/m³, adds $0.023/kg, about 0.9% of the electricity cost. Even the worst cell, 30 L/kg at $3.00/m³, adds $0.090/kg, or 3.6% of the electricity cost. For comparison, raising the power price by just $5/MWh adds $0.275/kg, about three times the worst water case.
Energy tells the same story. At 15 L/kg and 3.5 kWh/m³, desalination uses about 0.052 kWh per kg of hydrogen, roughly 0.1% of the electrolyzer's 55 kWh/kg. At full load that is a desalination load of about 0.1 MW beside a 100 MW electrolyzer. Even at 30 L/kg and 6 kWh/m³, the load is about 0.33 MW.
A water price would need to reach about $6.67/m³ before 15 L/kg added $0.10/kg. If your first desalination quote is anywhere near that, check the scope: it probably includes marine works or long pipelines that should be assessed separately.
Watch the ReneEnergy video: How Much Does Seawater Add to Hydrogen Cost?
What the example leaves out
The cost-per-cubic-metre approach assumes the water plant is bought as a service or that its capital is already included in the price. It ignores storage tanks sized for the electrolyzer's ramping, the polishing step to electrolyzer purity if not included in the price, and cooling-water systems, which can be the largest water flow on some sites. It also ignores the cost of an intake and outfall if they must be built specially, which depends on coastline, depth and distance and is best priced by a marine engineer.
The real seawater checks
Because the per-kilogram cost is small, a coastal site lives or dies on deliverability. Add these checks to your green hydrogen site selection checklist:
- Intake and outfall route. Where can seawater be drawn and brine returned, and how far is the shoreline from the plant? IRENA used 50 km from the coast as its screening limit.
- Brine discharge approval. In the example, brine volume equals fresh water produced. The UK guidance lists RO effluent containing ions from the feedwater and high-salinity effluents among streams that may need treatment before discharge.
- Matching a variable electrolyzer. Peak fresh-water demand at full load is about 1.9 times the annual average in this example (27.3 against 14.0 m³/h), since the plant runs 4,500 of 8,760 hours. Decide whether the RO plant follows the electrolyzer or runs steadily into storage.
- Shared or dedicated plant. A connection to an existing industrial or municipal desalination plant may be cheaper than a small dedicated unit, but it needs a supply agreement.
- Feedwater specification. Ask the electrolyzer supplier for purity limits and what polishing is needed after RO.
- Cooling method. Decide early whether cooling uses seawater, fresh water or air, because it can change intake volumes more than the process water does.
Try it in H2Hub
You can start a project in H2Hub for free, without an account or a card, for the coastal site you are screening. Use this example's baseline: 100 MW, 55 kWh/kg, about 4,500 full-load hours and $45/MWh power. Then add the water line from the tables above, for example $0.023/kg, beside your result to see how small it is next to the power price.
Your first full project and its PDF report are free; downloading the PDF needs a free sign-in. Re-running with new inputs, such as a different power price, or starting a second project requires a subscription. The Water & Utilities Lab is a subscriber tool for working through water volumes in more depth; signed-out visitors see an introduction.
If you are still deciding what budget to put in for the electrolyzer itself, our guide to electrolyzer cost per kW explains which installed figure belongs in the model.
A note on pre-feasibility
These figures are a screening calculation from stated assumptions. They do not replace a water-treatment proposal, a marine survey or a discharge permit application, and they are not H2Hub-generated results.
Frequently asked questions
How much does it cost to make hydrogen from seawater?
The electrolysis cost is almost the same as with fresh water, because desalination adds only about $0.01–0.04/kg according to DOE. Total cost depends mainly on power price, electrolyzer cost and operating hours. In our example, electricity alone was $2.48/kg.
How much seawater is needed per kg of hydrogen?
With 15 litres of desalinated water per kg and 50% RO recovery, about 30 litres of seawater are drawn per kg of hydrogen, and about 15 litres return as brine. Cooling water is extra and depends on the cooling design.
How much energy does desalination add to electrolysis?
Seawater RO uses about 2.5–6 kWh per cubic metre according to the IEA. At 15 L/kg that is roughly 0.04–0.09 kWh per kg of hydrogen, against around 55 kWh/kg for the electrolyzer itself.
Is desalination a reason to avoid a coastal hydrogen site?
Usually not on cost grounds. Intake and outfall construction, brine discharge approval and land access are the factors to verify before relying on a coastal site.
Primary sources and further reading
- U.S. Department of Energy — Can water usage for electrolysis pose problems for parts of the United States currently facing water shortages? Added cost of desalination per kg of hydrogen.
- IRENA — Global hydrogen trade to meet the 1.5°C climate goal: Part III, Green hydrogen cost and potential, May 2022. Desalination cost ceiling, 50 km coastal screening and LCOH impact.
- International Energy Agency — Wired for water: How electrification is transforming desalination. Seawater RO energy use.
- European Commission, EU Blue Economy Observatory — Desalination, updated 21 May 2026. Life-cycle cost and energy share.
- International PtX Hub (GIZ) — Sustainability Briefing #2: Desalination, February 2024. Water per kg of hydrogen and seawater recovery.
- UK Government — Hydrogen production by electrolysis of water: emerging techniques, updated 29 September 2026. Reaction water and effluent streams.
- U.S. Department of Energy — Technical Targets for Liquid Alkaline Electrolysis. 55 kWh/kg system status value.
- ReneEnergy — How Much Does Seawater Add to Hydrogen Cost? (video).
Editorial verification: 13 November 2026. Worked examples are calculations from stated assumptions, not forecasts, market prices or H2Hub-generated results.